November 5, 2026
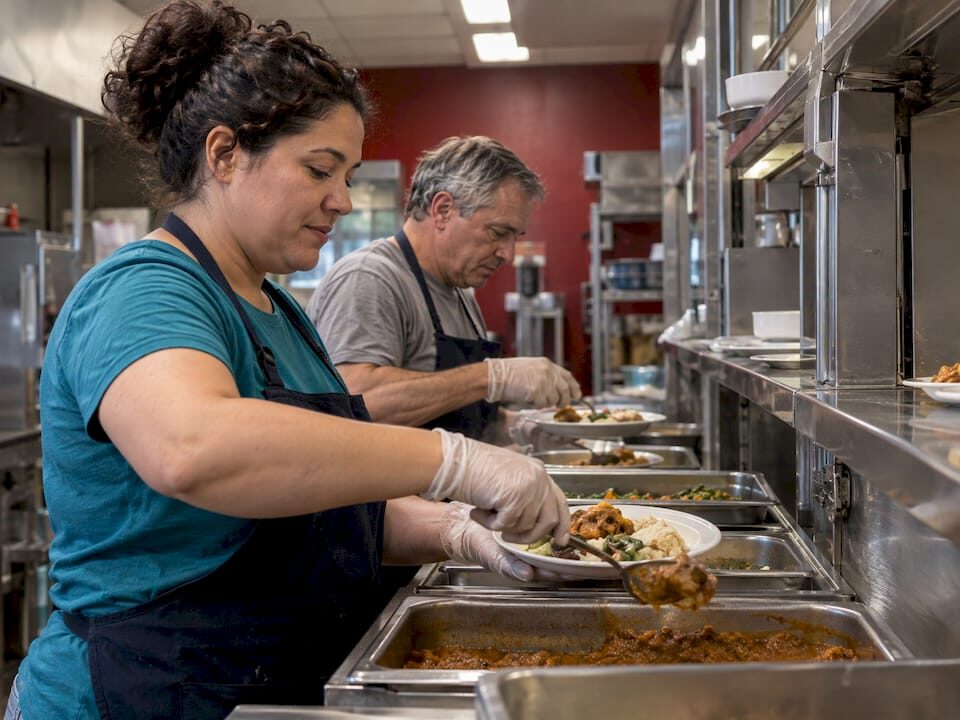
A practical guide to domestic mission trips for churches, youth and college groups: what the work looks like, how to prepare safely, and what NYC trips cost.

We also accept other Non-Traditional Gifts.
Click here to learn more
We also accept other Non-Traditional Gifts.
Click here to learn more
We also accept other Non-Traditional Gifts.
Click here to learn more
We also accept other Non-Traditional Gifts.
Click here to learn more
We also accept other Non-Traditional Gifts. Click here to learn more
We also accept other Non-Traditional Gifts. Click here to learn more
86,400 in Shelters: Homelessness Data for NYC Researchers
October 5, 2026
Mission Trip Planning for Churches: 7 Steps to Serve Safely in NYC
October 12, 2026New York School of Urban Ministry
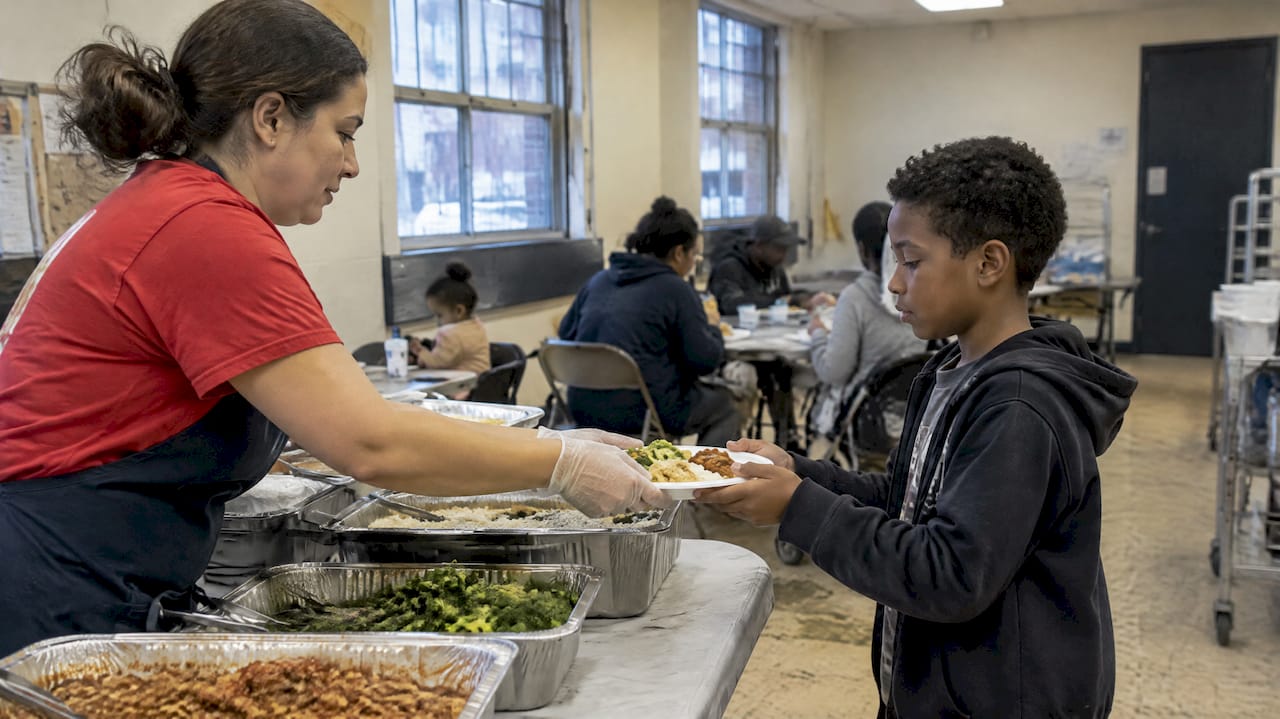
Poverty in New York remains above pre-pandemic levels, and child poverty has become the most urgent part of the story. Nearly one in five New York children lived in poverty in 2022 under the Official Poverty Measure, and more than 2.7 million New Yorkers were living in poverty that same year. Food insecurity and housing costs are the primary drivers behind these numbers, and the trend lines point in the wrong direction since federal pandemic relief expired.
TL;DR:
- Child poverty in New York increased to 18.8% in 2022, reversing pandemic-era gains caused by expanded federal benefits.
- Upstate cities like Buffalo, Rochester, and Syracuse have child poverty rates surpassing 40% in some neighborhoods, with persistent disparities in the Bronx.
- Housing costs remain the main driver of poverty, with many households spending over half their income on rent, limiting funds for essentials.
- Food insecurity affected about 11.3% of households during 2020 to 2022, rising after the end of expanded pandemic food assistance programs.
- Policy measures like the expanded Child Tax Credit temporarily lowered child poverty, but its expiration has caused rates to climb again.
The most recent figures from the Office of the New York State Comptroller show that 18.8% of New York children lived in poverty in 2022, a rate that climbed after a sharp pandemic-era dip tied to expanded federal benefits. Statewide, more than 2.7 million New Yorkers fell below the poverty line that year. The NYC Opportunity poverty measure, which adjusts for housing costs and noncash benefits, confirms that both poverty and near-poverty in New York City remain above where they stood before 2020.
A few numbers anchor the current picture:
One in five New York children lived in poverty in 2022, according to the Comptroller’s analysis, reversing gains made during the temporary expansion of federal child benefits. That reversal is the single clearest signal that relief programs, not just the broader economy, shape poverty rates in New York.
Poverty in New York concentrates heavily among children, and the disparities widen further along racial, nativity, and geographic lines. Deep poverty, meaning income far below the poverty threshold, falls disproportionately on Black and Hispanic households and on noncitizen families who often have less access to safety-net programs.
Geography also matters. The Comptroller’s report notes that child poverty is not just high statewide, it is concentrated in specific upstate cities where rates can exceed 40%. The Bronx consistently posts some of the highest poverty rates among New York City’s boroughs under the NYCgov measure, while upstate cities including Buffalo, Rochester, and Syracuse show similarly severe concentrations.
Key disparities to understand:
These patterns matter for anyone planning outreach: hardship in New York is not evenly spread, and the neighborhoods carrying the heaviest burden are often the ones with the thinnest service infrastructure.
Housing costs sit at the center of New York’s poverty picture. When a household spends more than 30% of its income on rent, it has little room left for food, health care, or savings, and many New York households cross that threshold well into the 50% range. That cost burden compounds everything else on this list.
Food insecurity has worsened even as the broader economy improved. One in nine New York households, about 11.3%, or roughly 875,000 families, experienced food insecurity at some point during 2020 to 2022, according to the Comptroller’s analysis. Food insecurity climbed after pandemic-era benefits like expanded SNAP allotments ended, even though employment numbers were recovering.
Homelessness tracks closely with these pressures. The NYC Department of Homeless Services estimated about 4,504 unsheltered individuals in New York City on the night of January 28, 2025, and ties homelessness directly to a lack of affordable and supportive housing. New York’s right-to-shelter policy keeps unsheltered counts comparatively low next to other major cities, even as shelter census numbers stay high.
Compounding factors include:
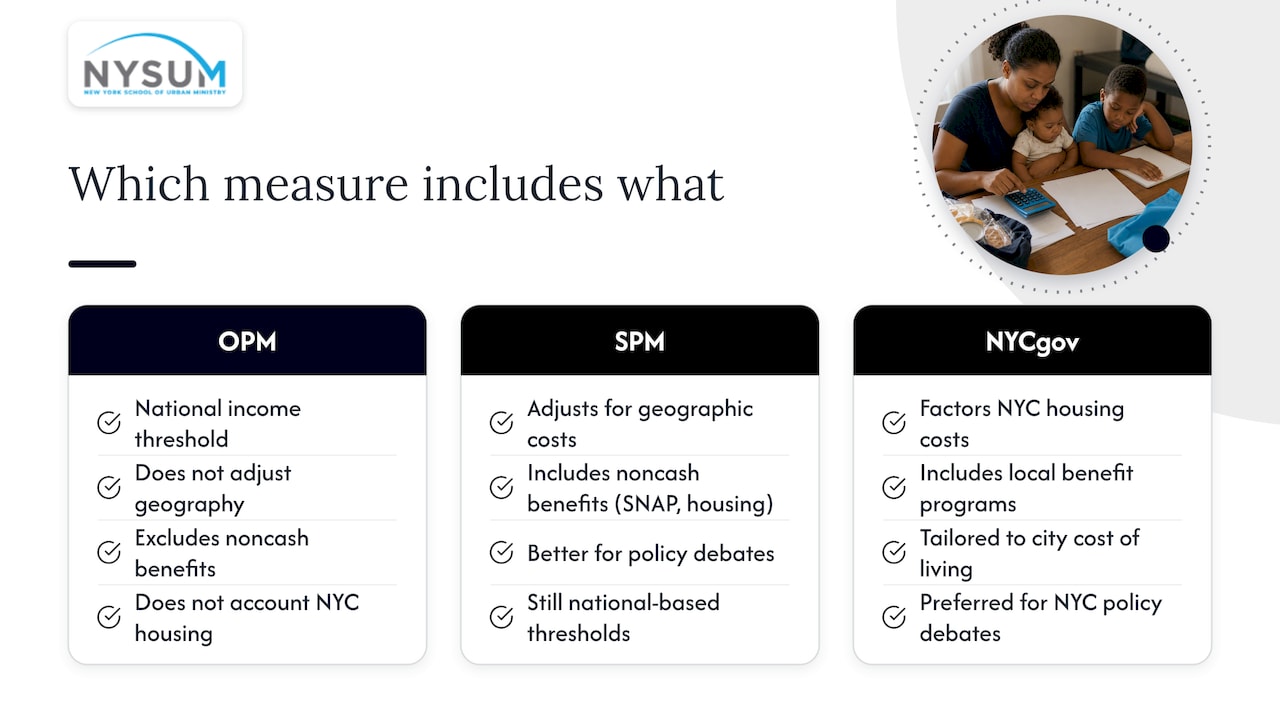
New York’s poverty numbers vary depending on which measure you cite, and that matters more here than almost anywhere else in the country. The Official Poverty Measure (OPM), used by the U.S. Census Bureau, sets a national income threshold that does not account for regional cost of living, housing assistance, or tax credits.
The Supplemental Poverty Measure (SPM) adjusts for geographic cost differences and includes noncash benefits like SNAP and housing subsidies. The NYCgov poverty measure goes further still, factoring in New York City’s unusually high housing costs and local benefit programs.
For policy debates, the SPM or NYCgov measure gives a more accurate read on lived hardship. For program eligibility, agencies typically still rely on the simpler OPM thresholds, so the “right” measure depends on what question you are asking.
The clearest evidence of how policy moves the needle on poverty comes from the pandemic-era expanded Child Tax Credit. That temporary federal benefit cut child poverty substantially nationwide and across New York, and child poverty rose again after the credit expired, a pattern documented in the Comptroller’s report on children in need. It stands as one of the strongest recent examples of a single policy lever producing a measurable, rapid change in family income.
New York has responded at the state level with targeted nutrition investments. Recent state budgets have expanded Summer EBT, increased school lunch and breakfast funding, and boosted allocations to the Hunger Prevention and Nutrition Assistance Program and Nourish New York, aiming to blunt the food insecurity spike that followed the end of federal pandemic benefits.
Where these programs differ matters for readers tracking policy:
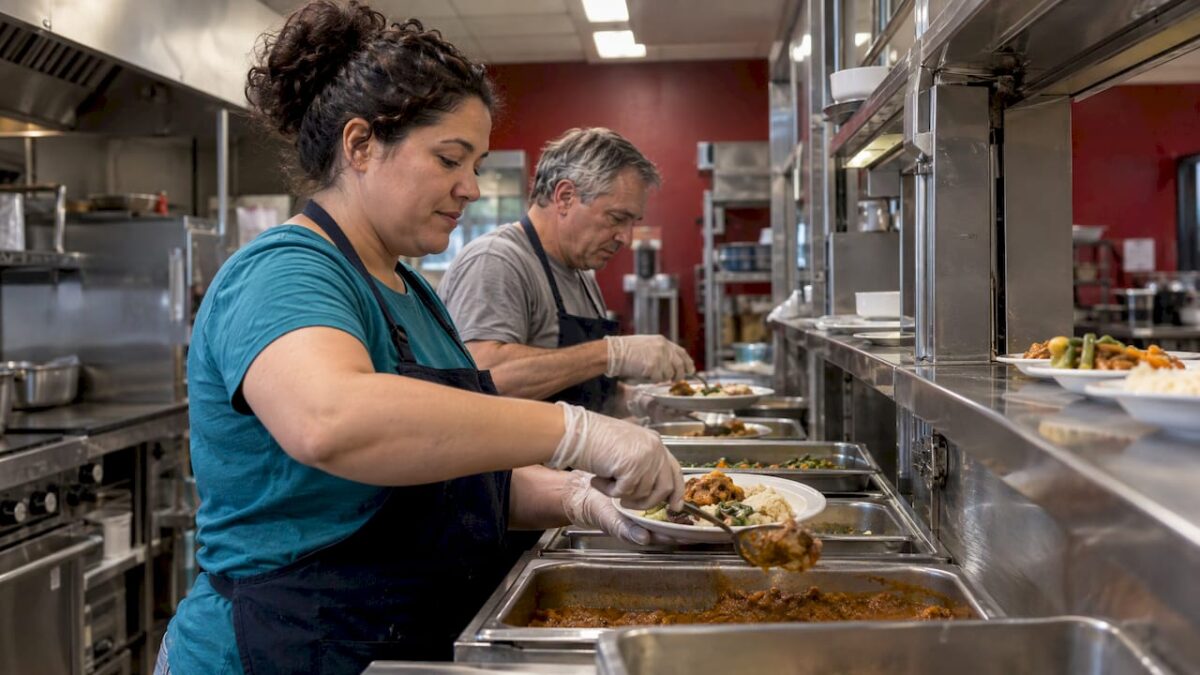
We train more than 5,000 participants annually and serve over 16,500 meals through outreach initiatives across New York City’s five boroughs. That scale only works because teams receive structured preparation before they ever serve a meal or pray with a neighbor on the street.
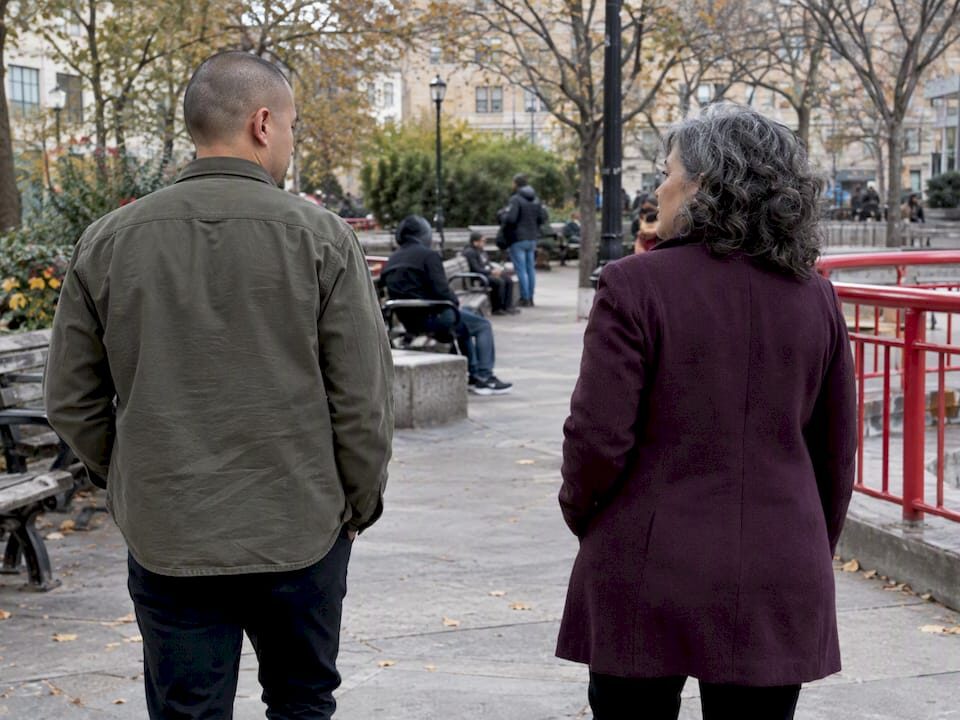
Groups that make a lasting difference typically focus on food outreach, street-level encouragement, and partnering with local churches on youth service projects rather than one-off events disconnected from ongoing community work. Before any trip, we recommend groups confirm training on trauma-informed engagement, coordinate closely with local partners, and commit to cultural humility rather than a rescue mentality.
Pro Tip: Ask your mission trip organizer how your team’s outreach connects to an existing local partner, not a standalone event, so your impact continues after your group goes home.
Education level and job quality shape poverty outcomes across New York as strongly as any other single factor. Adults without a high school diploma or college credential face far steeper odds of falling below the poverty line, and that gap widens in a labor market increasingly built around credentialed and technical roles.
New York City’s economy rewards specific skill sets unevenly. Finance, technology, and professional services pay well above the cost-of-living threshold, while retail, food service, and home health care, the sectors that employ a large share of lower-income New Yorkers, often pay wages that lag far behind the city’s housing costs. That mismatch between where jobs grow and what they pay helps explain why employment alone does not guarantee a family escapes poverty.
Upstate New York faces a different version of the same problem.
Workforce training and continuing education remain among the more durable paths out of poverty, since credentials tied to growing sectors, health care, skilled trades, and technology, tend to produce wage gains that outlast short-term relief programs. Community colleges and vocational programs across the state play a role here, though access gaps persist for students juggling work and family responsibilities. For families already stretched thin by rent and food costs, finding time and money for additional training is often the hardest barrier of all, which is part of why housing and nutrition support programs matter alongside education policy rather than as a substitute for it.
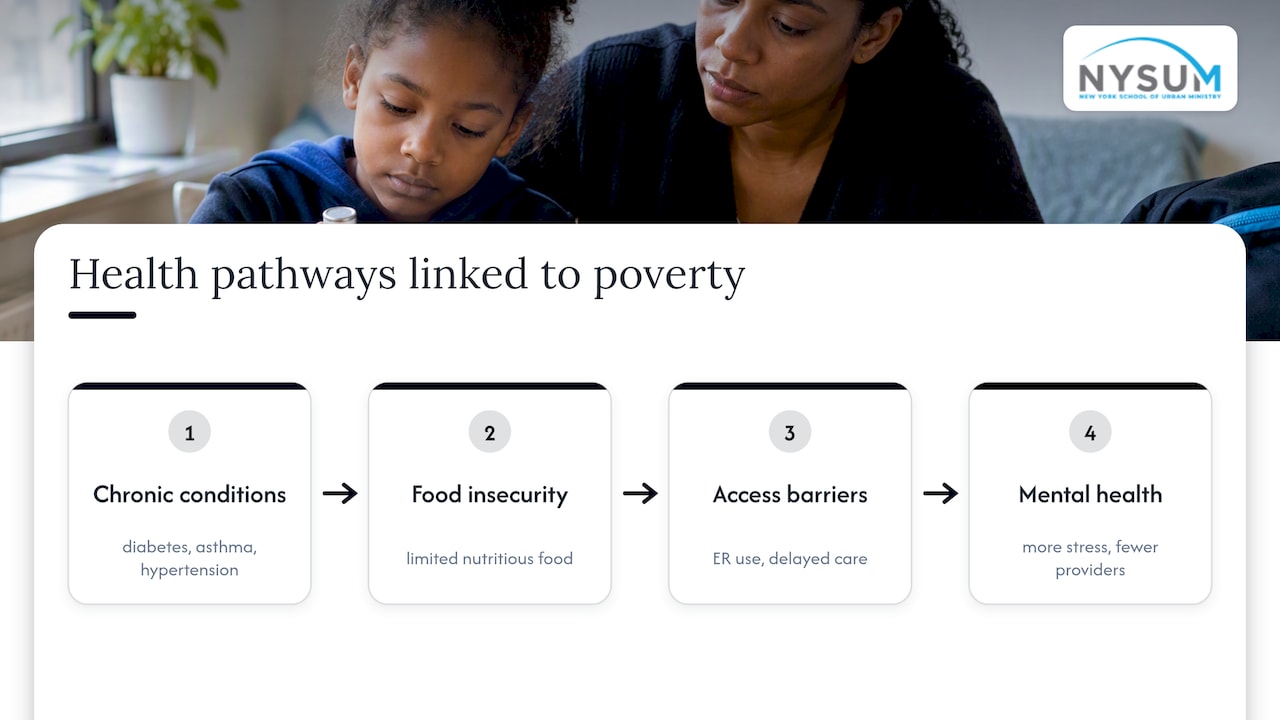
Poverty and health outcomes move together in New York, and the connection runs in both directions. Lower-income households face higher rates of chronic conditions like diabetes, hypertension, and asthma, partly because of housing quality, food access, and chronic stress, and partly because medical debt or lost wages from illness can push a family deeper into poverty.
Food insecurity plays a direct role here. Households with children experienced notably elevated food insufficiency during 2021 through 2023, a period when grocery costs climbed sharply across the New York City metro area. Inconsistent access to nutritious food contributes to worse health outcomes in children, including developmental and behavioral effects that can compound over time.
Access to care compounds the problem. Low-income New Yorkers are more likely to rely on emergency rooms for primary care, delay treatment because of cost, or live in neighborhoods with fewer clinics and pharmacies. The Bronx, which carries some of the city’s highest poverty concentrations, also consistently reports some of the city’s steepest rates of chronic disease and lower life expectancy compared to wealthier boroughs.
Mental health gaps add another layer. Financial stress, housing instability, and food insecurity are all linked to higher rates of anxiety and depression, yet lower-income neighborhoods frequently have fewer mental health providers per capita than wealthier areas. For families already managing poverty, the added burden of untreated health conditions, physical or mental, can make stable employment and housing even harder to sustain. This is part of why outreach efforts in high-poverty neighborhoods that include basic health screenings or referrals alongside food distribution tend to meet a broader set of needs than food alone.
Immigration status shapes both poverty exposure and the ability to access help in New York, often in ways that compound rather than operate independently. Noncitizen households face higher poverty rates than citizen households on average, and many federal safety-net programs, including SNAP and certain tax credits, restrict eligibility based on immigration status, leaving a meaningful share of low-income immigrant families without access to the same supports available to citizen households at similar income levels.
New York City’s shelter system illustrates this dynamic clearly. Asylum seekers have become a growing share of the population relying on city shelters, a trend the Office of the State Comptroller notes complicates simple narratives that tie homelessness directly to local poverty alone. Many new arrivals face work authorization delays, language barriers, and unfamiliarity with available services, all of which slow the path toward stable income even when they are eager to work.
State and city programs have adapted unevenly to this reality. Some benefits, including certain nutrition and health programs, remain available regardless of immigration status, while others require documentation many recent arrivals do not yet have. For mission teams and volunteer groups working in immigrant-dense neighborhoods, this means outreach often needs to pair directly with organizations that understand documentation requirements and language access, rather than assuming every family can access the same resources. Immigration status is not a side detail in New York’s poverty story. It is one of the clearest lines separating who can access relief and who cannot.
New York benefits from a dense network of nonprofit and faith-based organizations working alongside government programs to address poverty, often filling gaps that public systems cannot reach quickly. Food pantries, soup kitchens, and emergency shelters operate in nearly every neighborhood with elevated poverty rates, frequently run by churches, community boards, or citywide hunger relief networks.
These organizations tend to work best when they coordinate rather than duplicate services. A pantry that partners with a local church’s outreach ministry, for instance, can extend its reach into a congregation’s existing relationships of trust, which matters enormously in neighborhoods wary of outside intervention. Partnerships between established local nonprofits and visiting volunteer groups, including church groups planning mission trips, tend to produce more consistent outcomes than isolated, one-time service events.
Smaller community-based organizations also play an outsized role in neighborhoods like the Bronx and parts of upstate New York, where larger citywide nonprofits may have thinner coverage. These groups often know which families are falling through program gaps long before government data catches up, making them valuable partners for any outside team hoping to serve responsibly rather than performatively.
Poverty and public safety are connected in New York, though the relationship is more about shared root causes than a simple cause-and-effect line. Neighborhoods with concentrated poverty often also face underinvestment in schools, housing quality, and youth programming, conditions that research broadly associates with higher rates of certain property crimes and community instability, even though poverty alone does not determine crime rates.
The Bronx and parts of upstate cities like Buffalo and Rochester, which carry some of the state’s highest poverty concentrations, have also historically reported elevated rates of certain violent and property crimes compared to wealthier parts of the state. Reentry barriers compound this cycle: residents returning from incarceration often face steep odds finding stable housing and employment, which increases the risk of returning to the same unstable conditions that contributed to justice system involvement in the first place.
Public safety investments that address root economic conditions, affordable housing, youth employment programs, and reentry services, tend to show more durable results than enforcement-only approaches, though a full accounting of effectiveness is beyond what poverty statistics alone can show. What the data does make clear is that neighborhoods facing the deepest poverty in New York are frequently the same ones facing the thinnest public safety investment outside of policing itself.
The clearest lesson here is that policy choices, not just economic growth, move New York’s poverty numbers. The expanded Child Tax Credit proved that quickly. Readers interested in staying informed should follow release schedules from the Census Bureau and the NYCgov poverty measure, and researchers doing local analysis should favor NYCgov’s housing-adjusted figures over national OPM data when studying neighborhood-level hardship.
— Pastor Peter M. DeArruda NYSUM President
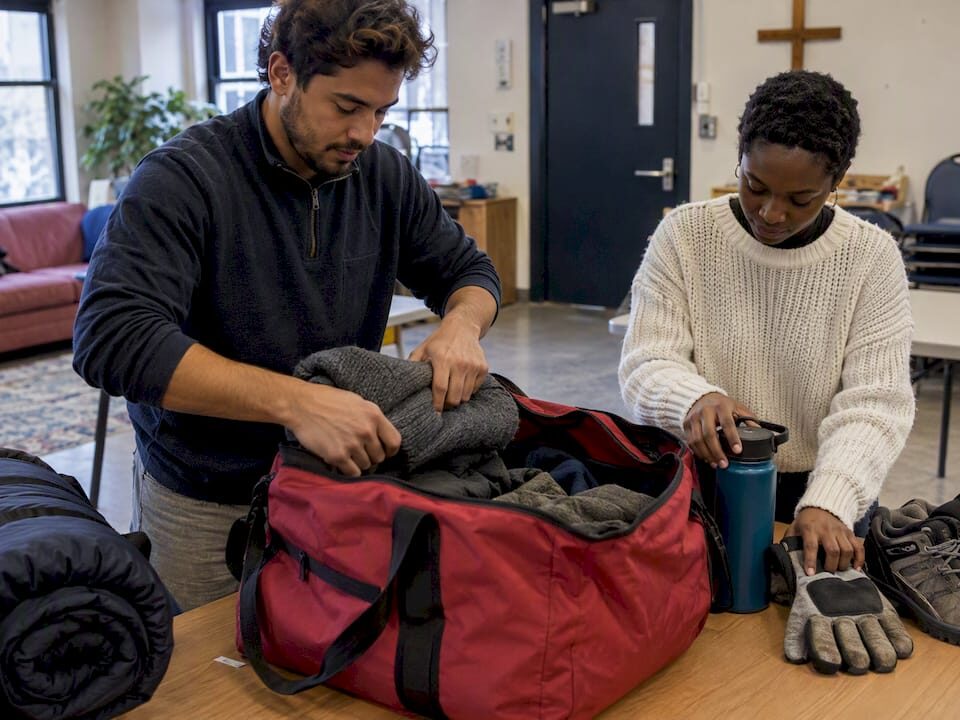
Short-term mission trips provide churches, youth groups, and college ministries a structured way to serve New York City’s neighborhoods facing the pressures this article has covered: food insecurity, housing strain, and gaps in local support. The packages combine hands-on outreach with training that prepares your team before you ever set foot on the street.
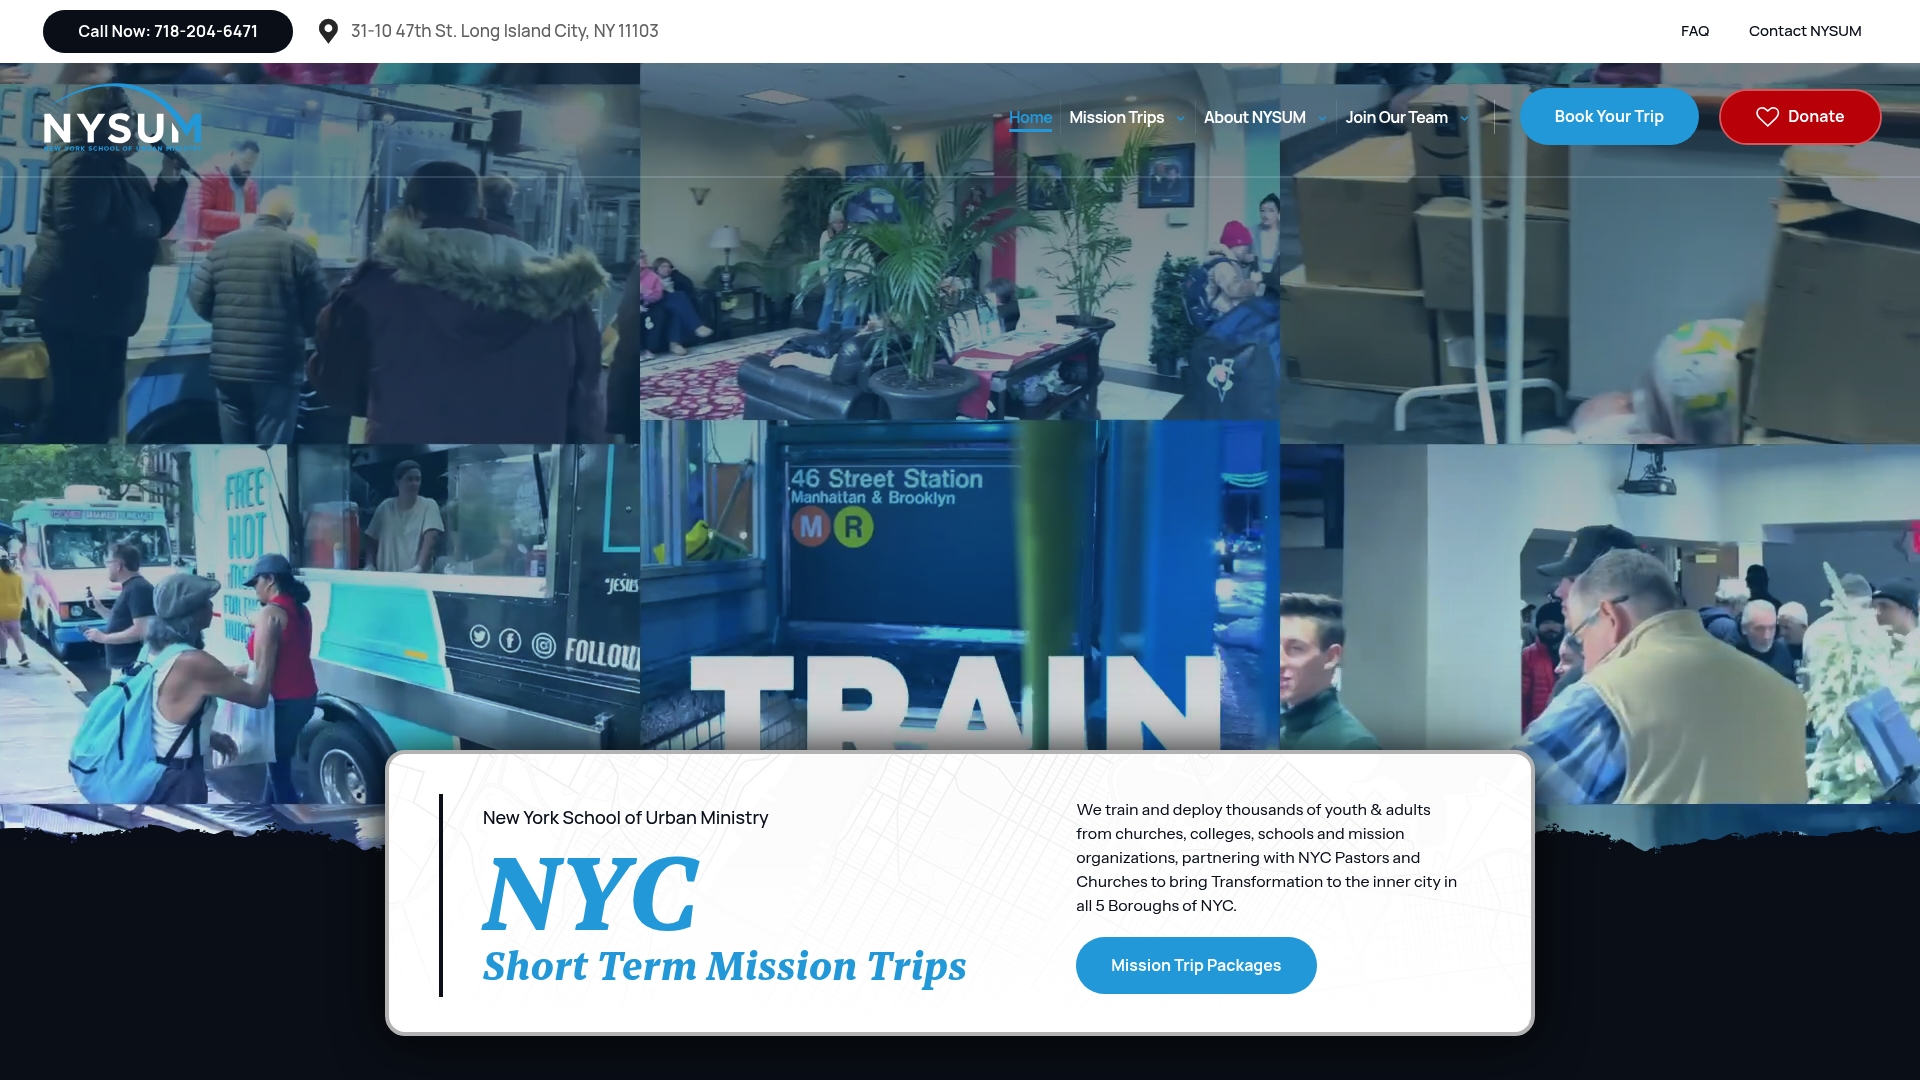
Trained, coordinated teams tend to leave a more lasting mark than ad-hoc volunteering because we connect every trip to ongoing local partnerships rather than one-time events. If your church, youth group, or college ministry is ready to put faith into action in New York City, explore our reservations and mission packages to find the trip that fits your group.
This article is general information, not a substitute for advice from a qualified financial advisor. Consult a qualified financial professional about your own circumstances before acting on anything here.
Whether an income level counts as poverty depends on household size and which measure you use. Under the Official Poverty Measure, a family of four nationally sits near its threshold, but New York’s high housing costs mean the NYCgov poverty measure often classifies a similar household as near-poor or in poverty once local rent is factored in.
Several upstate cities report severe concentrated poverty, with child poverty rates exceeding 40% in some neighborhoods, according to the Comptroller’s analysis. Rochester, Buffalo, and Syracuse all show some of the state’s highest concentrated poverty rates outside New York City.
National poverty rankings shift from year to year and depend on which measure and city size threshold is used. Readers researching current rankings should consult the U.S. Census Bureau’s poverty briefs directly rather than relying on a single repeated figure, since estimates vary by survey year and methodology.
The Bronx consistently ranks among the areas with the highest poverty concentration within New York City, and several upstate counties surrounding cities like Buffalo and Rochester report elevated child poverty rates as well, per the Comptroller’s report. Exact county rankings shift depending on whether you use the OPM or a housing-adjusted measure.
Churches, youth groups, and college ministries can join a structured mission trip through NYSUM’s reservations page, which offers packages ranging from a single weekend to a full week of training and outreach. Groups that pair with established local partners tend to leave a more lasting impact than isolated service events.
Tel: 718.204.6471 | Email: info@nysum.org
This website uses cookies
We use cookies to personalise content and ads, to provide social media features and to analyse our traffic. We also share information about your use of our site with our social media, advertising and analytics partners who may combine it with other information that you’ve provided to them or that they’ve collected from your use of their services.
Cookies are small text files that can be used by websites to make a user's experience more efficient.
The law states that we can store cookies on your device if they are strictly necessary for the operation of this site. For all other types of cookies we need your permission. This means that cookies which are categorized as necessary, are processed based on GDPR Art. 6 (1) (f). All other cookies, meaning those from the categories preferences and marketing, are processed based on GDPR Art. 6 (1) (a) GDPR.
This site uses different types of cookies. Some cookies are placed by third party services that appear on our pages.
You can at any time change or withdraw your consent from the Cookie Declaration on our website.
Learn more about who we are, how you can contact us and how we process personal data in our Privacy Policy.
Please state your consent ID and date when you contact us regarding your consent.