November 5, 2026

A practical guide to domestic mission trips for churches, youth and college groups: what the work looks like, how to prepare safely, and what NYC trips cost.

We also accept other Non-Traditional Gifts.
Click here to learn more
We also accept other Non-Traditional Gifts.
Click here to learn more
We also accept other Non-Traditional Gifts.
Click here to learn more
We also accept other Non-Traditional Gifts.
Click here to learn more
We also accept other Non-Traditional Gifts. Click here to learn more
We also accept other Non-Traditional Gifts. Click here to learn more

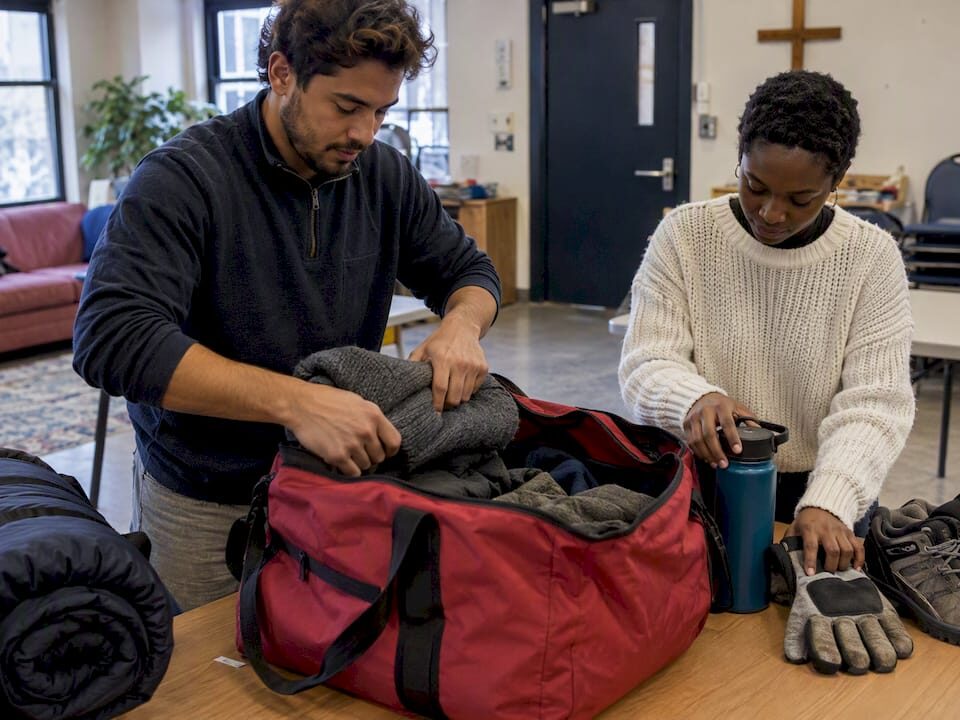
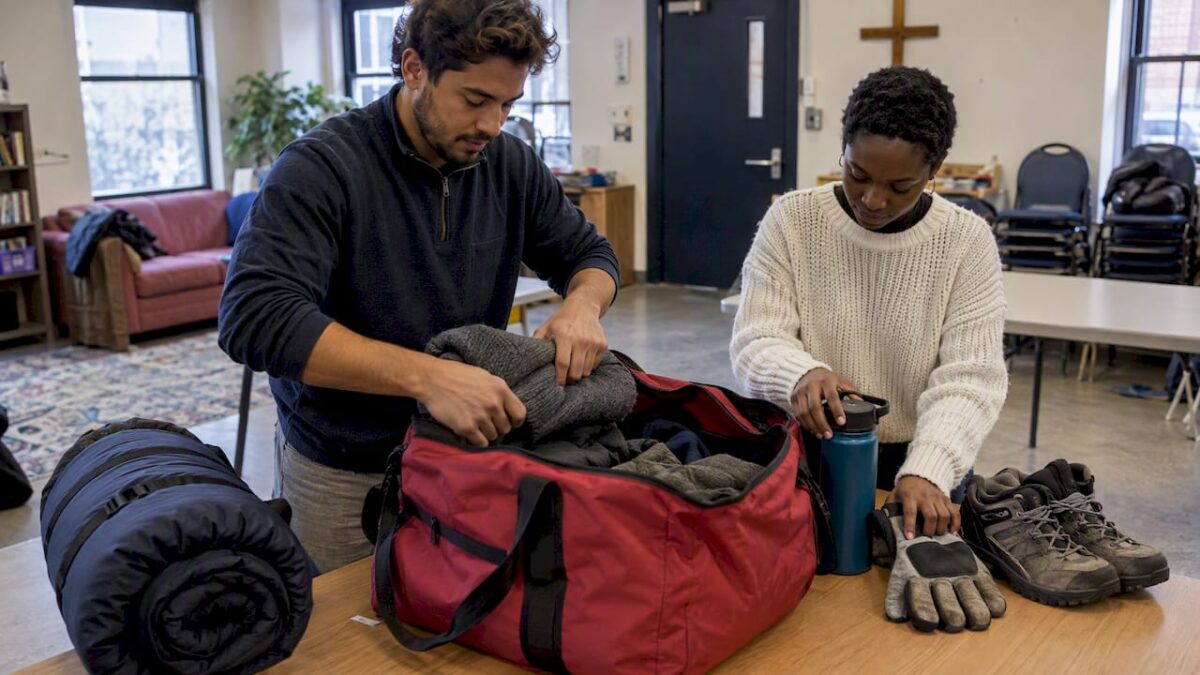
Care Bag List: Five Essentials and Safety for Church and Campus Leaders
September 28, 2026
One in Five Children in New York Live in Poverty: Data, Causes, Help
October 7, 2026New York School of Urban Ministry
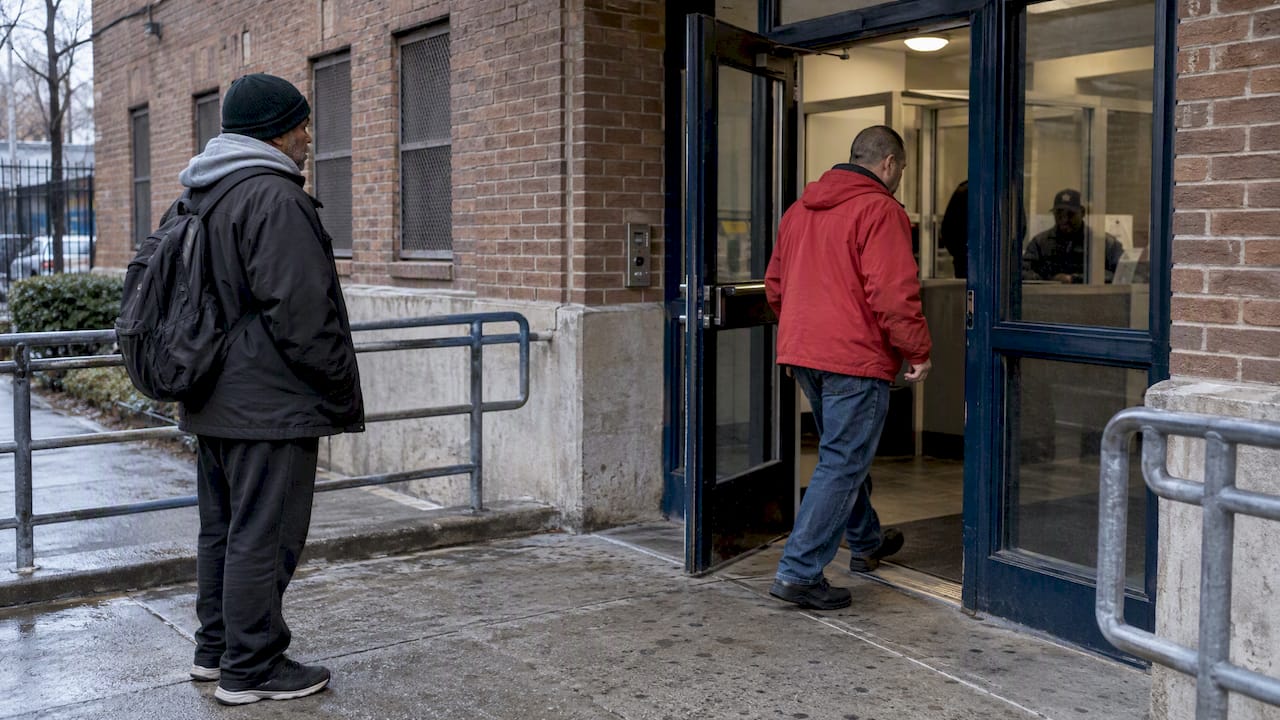
As of April 2025, the average daily number of people in New York City shelters topped 86,400, and researchers estimate that newly arrived asylum seekers account for roughly 59 to 62 percent of the sharp 2022 to 2024 increase in sheltered homelessness nationwide, concentrated heavily in New York. The city’s own dashboards and the Comptroller’s office track these numbers daily, and we believe anyone researching this topic should start there.
TL;DR:
- The number of asylum seekers in shelters peaked near 70,000 in January 2024 and declined to about 33,300 by September 2025, indicating rapid shifts tied to policy and migration patterns.
- A national study attributes roughly 59 to 62 percent of the 2022 to 2024 increase in sheltered homelessness to newly arrived migrants, with the surge heavily impacting New York City.
- New York City’s shelter census regularly exceeds 86,400 individuals each night, with the actual total likely higher due to unseen populations like doubled-up households and unsheltered residents.
- The city’s legal right to shelter, established by a 1981 court decree, obligates it to serve anyone requesting a bed, keeping shelter counts higher than in cities without such a mandate.
- Data sources such as DHS reports, the Comptroller’s asylum count, and HUD estimates should be triangulated, as they reflect different populations and timelines, leaving about 40 percent of recent increases unexplained.
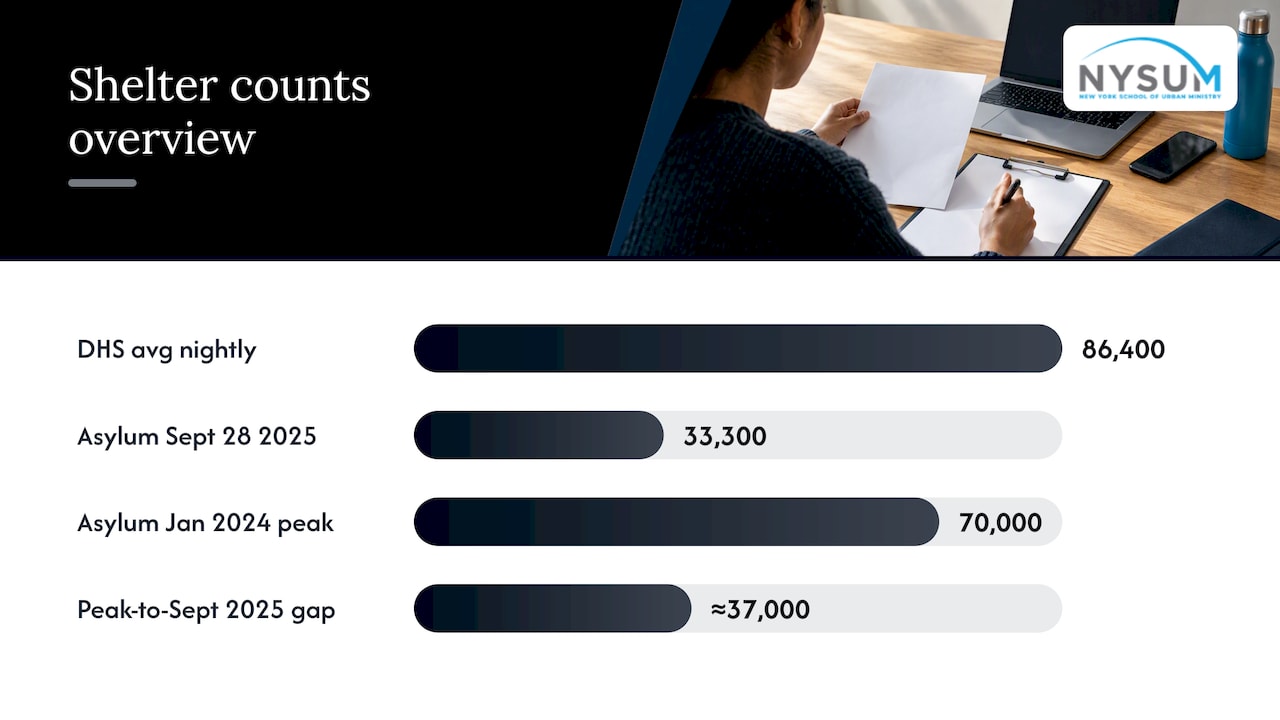
New York City’s shelter system serves more people on a given night than most American cities hold in total population. The DHS Monthly Management Report put the Fiscal 2025 average daily shelter census above 86,400 individuals, a figure drawn from nightly administrative counts rather than a single snapshot survey.
Unsheltered homelessness is measured differently, through the annual HOPE count. The January 2025 HOPE survey estimated several thousand people sleeping outside the shelter system on a single night, a point-in-time estimate rather than a running average.
Asylum-seeker shelter use has its own separate tracking. The NYC Comptroller’s asylum-seeker census counted about 33,300 asylum seekers in city-funded shelters as of September 28, 2025, down sharply from a peak near 70,000 in January 2024.
The gap between the January 2024 peak and the September 2025 count, roughly 37,000 fewer people, shows how quickly asylum-related shelter use can shift with policy and migration patterns, according to the Comptroller’s reporting.
The sharpest rise in New York City’s shelter population in recent memory did not happen in a vacuum. A working paper published by the National Bureau of Economic Research found a 43 percent national increase in sheltered homelessness between 2022 and 2024, and attributed an estimated 59 to 62 percent of that national rise to newly arrived migrants, with the effect concentrated in four localities, New York City chief among them.
That leaves a meaningful share of the increase unexplained by migration alone. Researchers point to several plausible contributors beyond asylum-seeker arrivals.
The pattern itself was not steady. Shelter counts climbed rapidly through 2023 and into early 2024, then began easing as federal border policy changed and the city adjusted shelter intake and stay rules, a trend visible in the decline from the January 2024 peak documented by the Comptroller.
Understanding New York’s homelessness figures requires knowing which count you are reading. The city and federal government use several distinct methods, each built for a different purpose.
Dates matter more than they first appear. A DHS monthly average from April 2025 and a Comptroller asylum count from September 2025 measure different things on different timelines, and mixing them without noting the gap produces misleading comparisons.
Families with children make up a substantial share of New York City’s shelter population, a pattern that distinguishes the city from many others where single adults dominate shelter rolls. The DHS Data Dashboard breaks these figures down by household type, race, and ethnicity for researchers who need granular detail.
Black and Hispanic households appear in the shelter system at rates disproportionate to their share of New York City’s overall population, a pattern the DHS dashboard documents consistently across fiscal years. Researchers generally link this disparity to broader structural factors, including concentrated poverty, housing discrimination history, and uneven access to stable employment.
New York City operates under a unique legal framework. The 1981 consent decree in Callahan v. Carey established a right to shelter, meaning the city is legally obligated to provide a bed to anyone who asks, a policy that keeps far more people inside the counted system than in cities without such a mandate.
Recent years brought real strain on that commitment. The city introduced shelter stay time limits for some single adults and families, closed a number of emergency sites opened during the asylum-seeker surge, and faced legal challenges over how those limits were applied.
Each of these shifts changes not just the paperwork but the lived experience of people cycling through the system, and researchers should treat count changes around policy shifts as signals worth investigating rather than noise.
Researchers who want to verify any figure in this piece, or track changes over time, have a handful of primary sources worth bookmarking.
When citing any of these, note the exact date of access and the dataset name, since each source updates on its own schedule.
We design our mission trip packages to address the realities described by these datasets. Our teams prepare before ever stepping onto a New York City street, learning the difference between a crisis response and a lasting one.
Pro Tip: Review current DHS and Comptroller figures with your team before a trip so volunteers understand the scale and causes of what they will witness firsthand.

Triangulating DHS, Comptroller, HUD, and NBER data gives a sturdier picture than any single source, and we believe that remains the most honest way to read this issue. The unresolved roughly 40 percent of the 2022 to 2024 increase not explained by asylum-seeker arrivals deserves more attention than it has gotten.
Watch shelter-exit rates, CityFHEPS placement volume, and the next PIT update for early signals of where the numbers head next.
— Pastor Peter M. DeArruda NYSUM President
We invite churches, youth groups, college ministries, and volunteer teams to turn this research into hands-on service through a mission trip to New York City. We offer options suited for different levels of engagement, ranging from introductory urban ministry experiences to packages with direct outreach opportunities.
Reserve your dates and review package details on our reservations page, and consider pairing your trip with a visit to our ministry training programs if your group wants deeper preparation beforehand.
New York’s right to shelter, established by the 1981 Callahan v. Carey consent decree, legally obligates the city to house anyone who requests a bed, which keeps shelter counts higher than in cities without that mandate. The 2022 to 2024 surge in particular was driven largely by newly arrived asylum seekers, who researchers estimate accounted for 59 to 62 percent of the national increase in sheltered homelessness during that period.
National rankings depend on whether you measure total count or rate per capita, and figures shift year to year based on HUD’s Point-in-Time counts. New York City’s shelter system, reflecting its unique right-to-shelter law, consistently shows among the highest sheltered population totals of any American city, driven in part by the asylum-seeker shelter surge tracked by the Comptroller’s office.
New York City’s average daily shelter census exceeded 86,400 people in Fiscal 2025, a figure that represents sheltered individuals and does not include the unsheltered population or households doubled up with family or friends. Calculating an exact percentage of the city’s total population requires combining several distinct data sources, each measured on a different timeline.
Rankings vary by whether a report measures total sheltered population, unsheltered population, or per capita rates, and HUD’s national Point-in-Time counts remain the standard comparison tool. New York City routinely appears near the top of sheltered population rankings nationally, largely due to its legal right-to-shelter mandate combined with the asylum-seeker arrivals documented in recent NBER research.
Tel: 718.204.6471 | Email: info@nysum.org
This website uses cookies
We use cookies to personalise content and ads, to provide social media features and to analyse our traffic. We also share information about your use of our site with our social media, advertising and analytics partners who may combine it with other information that you’ve provided to them or that they’ve collected from your use of their services.
Cookies are small text files that can be used by websites to make a user's experience more efficient.
The law states that we can store cookies on your device if they are strictly necessary for the operation of this site. For all other types of cookies we need your permission. This means that cookies which are categorized as necessary, are processed based on GDPR Art. 6 (1) (f). All other cookies, meaning those from the categories preferences and marketing, are processed based on GDPR Art. 6 (1) (a) GDPR.
This site uses different types of cookies. Some cookies are placed by third party services that appear on our pages.
You can at any time change or withdraw your consent from the Cookie Declaration on our website.
Learn more about who we are, how you can contact us and how we process personal data in our Privacy Policy.
Please state your consent ID and date when you contact us regarding your consent.